Research Article | | Peer-Reviewed

A Numerical and Experimental Investigation of Fluid Flow Through a Venturi Tube

Received: 18 October 2025     Accepted: 30 October 2025     Published: 9 December 2025
Views:       Downloads:
Abstract

Venturi tubes serve as critical components in various engineering fields. This work focused on investigating the pressure distribution and velocity magnitude from inlet to outlet of the venturi tube, as well as the determination of its performance in terms of coefficient of discharge (CV) using the computational fluid dynamics (CFD) tool Ansys Fluent and experimental tests. The study was conducted in different water fluid actual mass flow rates from 0.1662 to 1.0272 kg/sec. The results show that increasing the inlet flow rate yields an increase in pressure drop, velocity magnitude, and a minor rise in the coefficient of discharge. The study also focused on the inlet/out and throat diameter ratio from 0.207 to 0.586, and the coefficient of discharge increased from 0.11 to 0.96, respectively. The performance is higher in the lowest diameter ratio. On the other hand, the flow separation gradually developed in the divergent section when the diameter ratio decreased. There was a small variation between the CFD results and the experimental test results. The CV was the main performance evaluation of the venturi tube and have 1.95% and 8.01% a maximum difference between the numerical simulation and experimental study results at various inlet flow rates, respectively. Similarly, the coefficient of discharge result difference between the numerical simulation and experimental test is 1.12%.

Published in American Journal of Mechanical and Industrial Engineering (Volume 10, Issue 6)
DOI 10.11648/j.ajmie.20251006.13
Page(s) 116-127
Creative Commons

This is an Open Access article, distributed under the terms of the Creative Commons Attribution 4.0 International License (http://creativecommons.org/licenses/by/4.0/), which permits unrestricted use, distribution and reproduction in any medium or format, provided the original work is properly cited.

Copyright

Copyright © The Author(s), 2025. Published by Science Publishing Group

Keywords

Venturi Tube, Computational Fluid Dynamics (CFD), Coefficient of Discharge, Pressure Drop, Mass Flow Rate

1. Introduction
Fluids are substances that flow readily due to large intermolecular gaps and do not have a defined structure. Gases and liquids belong to the category of fluids. Fluid flow is the motion of fluid subjected to various unbalanced forces. It is primarily a branch of fluid mechanics and is concerned with the dynamics of the fluid. The fluid’s motion will continue until new unbalanced forces are added to it. Venturi nozzles employ a fast-moving fluid stream to entrain practically quiescent suction fluids. The venturi tube is a throttle device. It is used as a measure of the fluid flow through a pipe. The construction of the tube cross-section is split into three different areas. The inlet corresponds to a nozzle, followed by a straight section (throttle) and finally a diffuser or divergent section with a defined extension angle.
The venturi tubes are popular in gas, wet gas, and liquid measurement applications and studies are being conducted to better understand their behavior and maximize their benefits. Some of the applications of the area are flow controller and flow meter , industrial application , pressure regulator , energy improvement , smoking exhaust performance improvement in tunnel fires , carburetor , Natural ventilation for buildings , and water treatment . The venturi tube is used in an industrial plant for many applications. Venturi tubes have the following characteristics: no obstruction to the flow down the pipe, made to fit any needed pipe size, temperature, and pressure; within the pipe does not affect the meter's accuracy, no moving components, and the exact shape required makes them quite expensive to manufacture . Generally, the venturi tubes are made up of three parts: a convergent portion (nozzle), a constant section (throat), and a progressive expansion or diffuser . As a result, fluid flow properties vary in various sections of the venturi tube. Such as the obstruction to the flow of fluid at the throat of the venturi meter tube causes a local pressure decrease in the region that is proportionate to the rate of discharge. Bernoulli’s equation is used to compute the fluid flow rate through pipes. There are many factors that influence the flow conditions inside the venturi tubes, such as venturi geometry , area , convergent angles , divergence angles , and others. In general, the structure of the venturi tube affects the fluid flow . On the other hand, venturi tube performance and flow dynamics depend on the ratio of the venturi tube diameters and fluid flow rates. As a result, calibration tests are required for flow analysis to ensure their accuracy by determining the venturi’s discharge coefficient. However, building a venturi tube experimentally can be expensive and time-consuming. Hence, the numerical method is preferred. Fortunately, a flow measurement apparatus with the venturi tubes installation is available in our laboratory.
Therefore, the purpose of this study is to explore the performance and flow profile inside the venturi tube numerically and verify it with experimental methods. This means that the numerical analysis results are compared with the experimental tests.
2. Materials and Methods
2.1. Numerical Methods
2.1.1. Geometrical Model and Study Parameters
The venturi tube dimensions are produced based on those available in the laboratory. Figure 1 demonstrates the venturi tube cross-section and the manometer tube installed on the laboratory test bench system. It has inlet, throat, and outlet sections in addition to the convergent-divergent cross-sections.
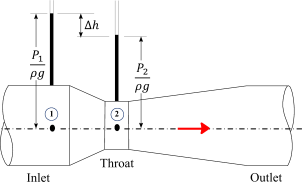
Figure 1. Installed venturi tube configuration on the test bench.
The pressure head is the height at which a liquid exerts pressure on a surface area. Pressure measurement devices measure pressure differences from atmospheric pressure. The water manometer connects to the venturi tube’s input and throat. The water supply is turned on. Water flows into the collecting tank through the Venturimeter. The venturi tube comprises manometers at sections 1 and 2, which then indicate the difference in water level, as shown in Figure 1. The two manometers have a pressure head difference ∆h.
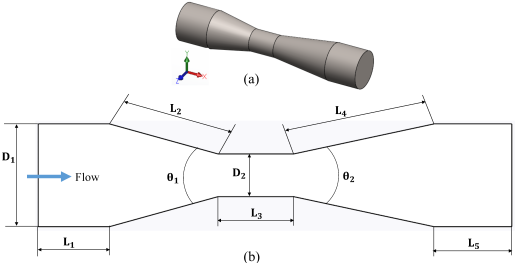
Figure 2. Geometrical model of the venturi tube and its dimension.
Therefore, this venturi meter model was created with ANSYS Design Modeler. Figure 2 shows the inside part of the venturi tube. Figure 2(a) illustrates the 3D configuration of the venturi tube installed on the experimental test bench. It has an inlet, outlet, throat, and convergent-divergent sections. However, the numerical analysis was done using 3D geometry. The geometrical model represents the inner or fluid regions of the venturi meter. In addition, the walls are stationary and no slip.
The geometry is discretized in to small parts with meshing process. Then, the simulation is performed in FLUENT solver applying the governing equations and Simple pressure-velocity coupling. The stages include defining the model, material, cell zone, boundary conditions, solving, iterating, and analyzing the results. Table 1 shows the water fluid properties at 25°C.
Table 1. Material properties .

Water properties at 25°C temperature

Value

Units

Density, ρ

997

kg/m3

Dynamics viscosity, µ

890×10-6

kg/(m.s)

Kinematic viscosity, ν

8.927×10⁻⁷

m2/s

Specific heat, Cp

4182

J/kg.K

The geometrical dimensions of the venturi tube and flow velocity parameter matrix used in the study are as shown in Table 2.
Table 2. Study parameter matrix.

No.

Diameters (mm)

Lengths (mm)

Flow rates (kg/s)

D1

D2

L1

L2

L3

L4

L5

1

29

17

25

32.92

20

49.23

25

0.1662 – 1.0272

2

29

6-17

25

32.92

20

49.23

25

0.5276

3

20-29

17

25

32.92

20

49.23

25

0.5276

Variations in dimensions D1 and D2 affect the convergent and divergent section angles θ1 and θ2. This means the two angles vary when D1is constant and D2 varies from 6 to 17mm. On the other hand, when D2 is constant and D1 varies from 20 to 29mm, the two angles are increased.
2.1.2. Governing Equations and Boundary Conditions
When the flow is very slow, the fluid particles move parallel to the surface wall in the same direction as the flow. Particles in the center of the geometry move faster than molecules near the wall. The venturi device is used to determine the flow rate by volume of a fluid using the venturi effect, which is the reduction of fluid pressure that results when fluid flows through a constricted section of pipe .
This phenomenon results from applying Bernoulli's equation to an incompressible fluid flow through a conduit surface with varying cross-sectional area. The following equation (1) is the Bernoulli’s equation between portions 1 and 2:
P1ρg+v122g+Z1=P2ρg+v222g+Z2(1)
However, z is the elevation of the two cross-section points. Since the venturi device is installed horizontally and it is approximately constant. This means the static head Z1=Z2. Then, the Bernoulli’s equation (1) becomes:
P1ρg+v122g=P2ρg+v222g=constant(2)
Where, P/ρg is the pressure head, and v2/2g is the velocity head. The equations that are solved include continuity or conservation of mass and the Navier-Stokes equations. The study follows a steady-state technique.
Applying the conservation of mass or continuity equation through sections 1 and 2:
V̇=v1A1=v2A2
v1=A2v2A1(3)
Then, combining of equations (2) and (3) above is the theoretical volumetric flow rate (V̇)
V̇=A12P1-P2ρA1A22-1=A22P1-P2ρ1-A1A22(4)
Where, P1-P2=P. Finally, the theoretical mass flow rate is the multiplication of the theoretical volumetric flow rate and density of the flowing fluid i.e. ṁtheoretical=V̇×ρ. Equation (5) below is then used to calculate the venturi meter coefficient of discharge (CV) by comparing the theoretical and actual flow rate findings.
CV=ṁactualṁtheoretical(5)
Where, ṁtheoretical is the mass flow rate resulted from the numerical calculation using equation (4), ṁactual is the actual inlet mass flow rate to the venturi meter. The flow turbulence and laminar nature is evaluated with the dimensionless value Reynold number, i.e. Red=4ṁ/πdμ. Where, µ is the dynamic viscosity, d is the diameter of the venturi tube section.
In general, computational fluid dynamics studies in a venturi tube, a viscous incompressible and in steady state fluid flow is controlled by a three-dimensional system of equations known as the Navier-Stokes equations, which includes momentum and continuity equations. The steady state and absolute velocity formulations were also chosen. Equation (6) is the continuity equation, whereas equations (7) to (9) are momentum equations along the x, y, and z-axes, respectively.
ux+vy+wz=0(6)
ut+uux+vuy+wuz=-1ρPx+ν2u(7)
vt+uvx+vvy+wvz=-1ρPy+ν2v(8)
wt+uwx+vwy+wwz=-1ρPw+ν2w(9)
Where, p is the total pressure, ρ is the density, t is the time, u, v, and w are the velocities in x, y, and z directions, respectively.
A Pressure-based solver was chosen. In this method, the pressure field is obtained by solving a pressure equation from the continuity and momentum equations. Additionally, absolute velocity and steady-state formulations were chosen. The κ-ε turbulence model, based on the eddy viscosity hypothesis, was used to represent a viscous incompressible flow with turbulence intensity.
The water velocity at the entry of the venturi tube is determined using the actual mass flow rate and the pressure inlet boundary condition. The venturi tube is considered a solid surface with stationary walls and a no-slip shear boundary condition. The pressure inlet and outflow are also applied to the venturi water inlet and exit boundaries, respectively. The pressure values at the pressure inlet and outflow boundaries are set to the atmospheric value and zero Pascal, respectively.
2.1.3. Mesh Independent Test
The mesh independence test needs to be performed in the simulation to determine the optimal mesh grid quality. An optimum mesh minimizes calculation time while maintaining result accuracy. Figure 3 shows the discretization of the venturi tube. Multiple discretization meshes are done in order to reduce computational time and ensure adequate accuracy of the results, as shown in Table 3. The mesh grid is done in different number of element sizes from 0.5 to 6.0mm.
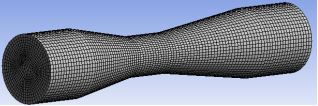
Figure 3. Geometrical mesh.
Table 3. Grid independence test.

Element size in mm

Average element quality

Average aspect ratio

Average orthogonal quality

∆P

CV

0.5

0.80544

1.8396

0.9891

262.21

0.98

1.0

0.73985

2.1124

0.98639

260.72

0.96

1.5

0.75612

2.2007

0.9845

259.10

0.96

2.0

0.7537

2.3278

0.97564

256.18

0.97

2.5

0.61921

2.7542

0.98283

256.30

0.96

3.0

0.69925

2.4388

0.97392

256.34

0.96

3.5

0.65248

2.6126

0.97775

256.95

0.96

4.0

0.7899

2.0548

0.97305

257.71

0.96

4.5

0.71501

2.3722

0.95772

258.90

0.95

5.0

0.78229

2.1041

0.96454

258.31

0.95

5.5

0.77081

2.2066

0.9644

257.29

0.96

6.0

0.75829

2.1242

0.95655

258.33

0.95

All meshes show no significant difference in pressure change and coefficient of discharge. The maximum number of elements is 1324600 with a small element size of 0.5mm. Similarly, the number of element becomes smaller when the element size increase to 6.0mm. However, in all cases, the value of ∆P and CV are smaller differences. Therefore, element size 1.5mm has been chosen for all cases simulations for computational economics advantage. On the other hand, the convergence of residues indicates good quality. Figure 4 shows the convergence of the 1.5mm grid element size up to 1000 iterations. The iterative convergences of all residues dropped below 10-4 in 1000 iterations.
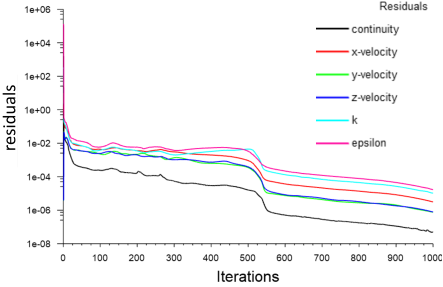
Figure 4. Convergence test for 65145 elements.
2.2. Experimental Methods
The available experiment setup components are connected in series, and all save the measuring tank are mounted on a waterproof panel, as shown in Figure 5. The main components of system are measuring tank, water meter, flow control valve, manometer, venturi meter and other flow measuring devices, as displayed in Figure 4. However, this study focused on only venturi meter flow measuring device. A stopwatch and a water meter reading are used to determine the flow rate. As result, the actual flow rate through the venturi meter was determined by timing the volume flow rate with a stopwatch. On the other hand, its pressure drop also determines the theoretical flow rate through the venturi meter. Therefore, manometer is used to monitor pressure drops with differential pressure. Pressure tapping is enabled with small ball valves with rapid connection. Water tanks are located on the backside of the panel. The water flow regulated with a flow control valve component.
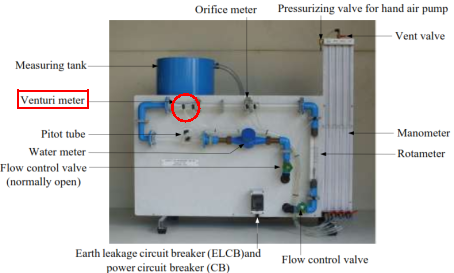
Figure 5. Experimental setup (test bench).
The experimental test process involved filling the storage tank with water and inspecting all pressure line connections to the venturi meter. The flow and pressure control valves were then opened, and the flow rate was adjusted to a high enough level to remove air bubbles from the system.
The manometer and rotameter readings, volume, and time are recorded to determine the ideal and actual flow rates. Finally, the experimental venturi meter coefficient of discharge result is important to validate the numerical result.
3. Result and Discussion
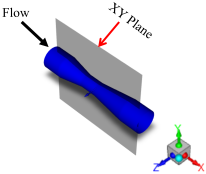
Figure 6. Position of plane to show the pressure and velocity results.
The numerical simulations and experimental tests of water flow through the venturi meter are considered at various flow rates. In the numerical simulations, the flow direction is from left to right, as shown in Figure 6. The study was focused on simulating the flow and evaluating the differential pressure drops and velocities in various inlet mass flow rates, and validating it with experimental tests. The pressure and velocity contours, as well as other plots, are obtained on the venturi meter XY plane when Z = 0. The axis of origin O (0, 0, 0) is taken as the flow inlet venturi tube base center. The numerical simulation result was displayed and plotted on this plane to investigate the flow conditions inside the venturi meter. Furthermore, the venturi tube performance in terms of the coefficient of discharge has been determined on the chosen XY plane.
The pressure contours are used to plot pressure distribution along the venturi meter. The distribution of each type of pressure (total, static, and dynamic) varies across the venturi meter's cross section. Figure 7(a) to (c) demonstrates the pressures distributions across the venturi tube. The total pressure is the sum of the static and dynamic pressure. This is related to the pressure and velocity of a flowing fluid as it passes over a smaller cross-sectional area. This phenomenon is described by the Venturi effect, which asserts that as a fluid's velocity increases, the pressure decreases due to the principle of mechanical energy conservation.
The static pressure distribution across the venturi tube show that decreases from the inlet to outlet portions. However, it is lower than at the throat portion than other portions due to its smallest portion of the venturi tube than other portions, as shown in Figure 7(a). As a result, the decrease in static pressure can easily be seen in the increase in flow velocity in the throat venturi tube portion. Therefore, the throat portion of the venturi tube has a higher dynamic pressure than the inlet portions. However, it gradually decreases along the outlet portion of the venturi tube when the venturi tube area increases, as shown in Figure 7(b). On the other hand, the venturi tube has highest velocity magnitude compared to inlet and outlet portions, as shown in Figure 7(d). The velocity magnitude and dynamic pressure follow a similar profile across the venturi tube. While there is no uniform profile in relation to static pressure.
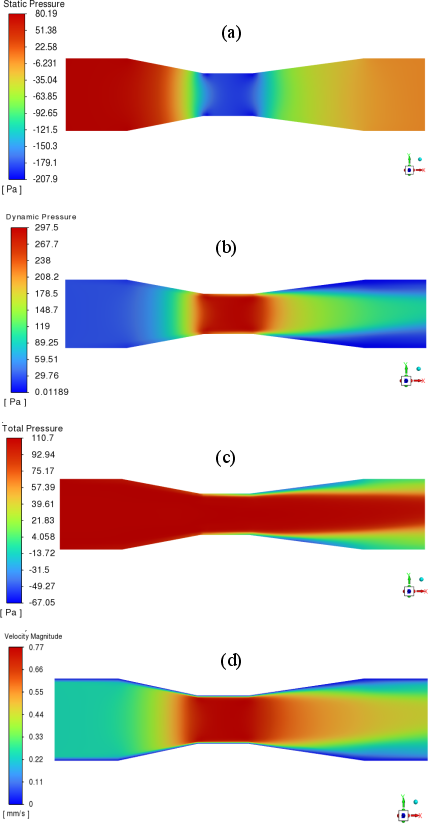
Figure 7. Pressure and velocity contours.
A velocity field is a description of fluid movement inside a given region or across a surface. It is defined by the velocity vectors at each point in the region or on the surface. The direction of the velocity vector-field determines the fluid flow direction. The velocity of the fluid increased as it passed through the reduced area portions. Therefore, since the throat portion of the venturi tube has a smaller area than the other portions, it creates the highest velocity field, as shown in Figure 8 below.
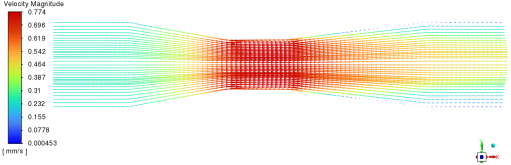
Figure 8. Velocity vectors.
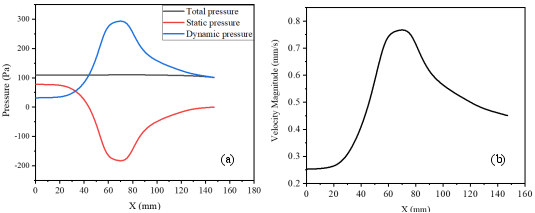
Figure 9. Velocity and pressure plots; (a) pressure, (b) velocity magnitude.
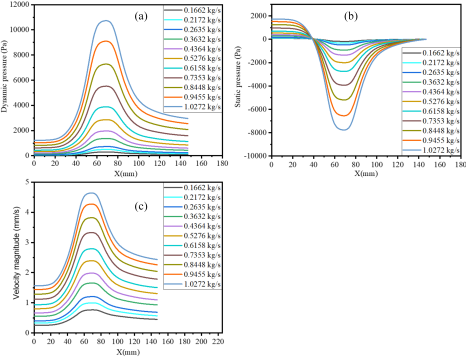
Figure 10. Velocity and Pressure comparison at z = y = 0 and different inlet flow rates.
Figure 9 shows velocity and pressure plots along the length and in the center of the venturi tube. It demonstrates that the velocity vector magnitude is the highest in the throat region compared to other venturi tube portions. Dynamic pressure has a similar profile to velocity vectors; however, static pressure is stronger around the venturi tube entrance portions than elsewhere.
The venturi tube pressure distribution and velocity magnitude are proportional to the inlet mass flow rate or velocity of the flowing water. Figure 10 shows the effect of the inlet mass flow rates of the flowing water across the venturi meter tube. The total pressure, which is the sum of static and dynamic pressure, is maximum for 1.0272kg/s due to its velocity is higher than that of other lower inlet mass flow rates. The velocity magnitude increased in each portion of the venturi meter tube. Similarly, the pressure distribution increased when the inlet mass flow rate increased.
With the same flow rate and other parameters, the maximum dynamic pressure occurred when the throat diameter, convergent, and divergent angles are higher, as shown in Figure 11. The flow adheres to Bernoulli's principles; however, a flow condition in flow direction change or flow rotation occurs in the divergent sections within the smallest throat dimensions compared to the biggest dimensions. The recirculation of flow during the transitions from throat (small area) to divergent section (large area) venturi tubes happened by the sudden expansion, resulting in a significant static pressure rise. This separation of the fluid flow from the tube walls creates a region of stagnant or backward-flowing fluid near the edges due to the fluid's inability to smoothly follow the expanding geometry, as shown in Figures 11(a) and (b). This phenomenon decreased as the throat diameter increased while the inlet and outlet diameters remained constant, as illustrated in Figures 11(c) and (d). This indicates that the throat and divergent dimensions have a great contribution for turbulence or flow back in the venturi tube.
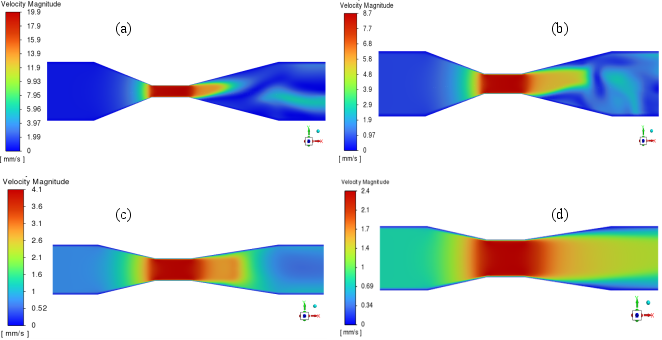
Figure 11. Velocity contours at different throat diameters; (a) 6mm, (b) 9mm, (c) 13mm, and (d) 17mm.
The convergent and divergent angles changed simultaneously as the throat diameter varied. Figure 12 shows velocity plots at various diameter ratios R, where R=D2/D1. The smallest diameter ratio R produces a high velocity in the throat region. In other words, a high flow separation occurred in the divergent section for a small diameter ratio.
The velocity plot and contours demonstrated that the streamline flow circulation at the beginning of the divergent section occurs when the throat diameter is much less than the inlet and outlet diameters of the venturi tube. The recirculation happens because of a sudden decrease in velocity and an increase in static pressure as the fluid near the boundary separates from the main flow and creates vortex motion in the enlarged region.
The discharge coefficient (CV) of the venturi tube was also evaluated using 0.5276 kg/s inlet flow rate and with diameter ratios 0.207, 0.310, 0.448, and 0.586, and resulting the CV values are 0.11, 0.11, 0.54, and 0.96, respectively.
The recording pressure measurements at both the upstream and throat sections of the venturi tube calculates the differential pressure for flow computation. Table 4 demonstrates that the venturi meter discharge coefficient (CV) is calculated based on the differential pressure and mass flow rate recorded. However, in all cases the difference between the CFD and experimental result is very small. When fluid flow accelerates to a high speed or flow rate, cavitation occurs . Therefore, the water flow rate in this investigation is very low.
Table 4. CFD and experimental CV results comparison.

ṁact (kg/s)

∆h (m)

ṁtheor (kg/s)

CV

CFD result

Experimental result

CFD result

Experimental result

CFD result

Experimental result

0.1662

0.0266

0.021

0.1740

0.1812

0.96

0.92

0.2172

0.0448

0.035

0.2260

0.2394

0.96

0.91

0.2635

0.0657

0.053

0.2737

0.2896

0.96

0.91

0.3632

0.1239

0.089

0.3757

0.3726

0.97

0.98

0.4364

0.1772

0.133

0.4494

0.4448

0.97

0.98

0.5276

0.2583

0.198

0.5425

0.5467

0.97

0.97

0.6158

0.3517

0.266

0.6330

0.6336

0.97

0.97

0.7353

0.4984

0.382

0.7536

0.7488

0.98

0.98

0.8448

0.6611

0.50

0.8678

0.8673

0.97

0.97

0.9455

0.8164

0.629

0.9645

0.9589

0.98

0.97

1.0272

0.9652

0.747

1.0487

1.046

0.98

0.98

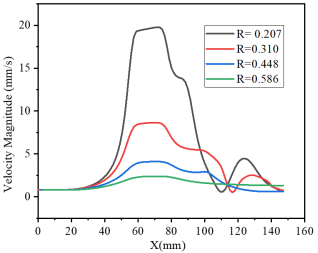
Figure 12. Velocity comparisons at different throat diameters.
Where, ṁact is the actual mass flow rate applied to the experimental test and numerical simulation, ∆h is the pressure head difference, ṁtheor is the theoretical or ideal mass flow rate, and CV is the venturi meter discharge coefficient. The rate of fluid flow is referred to as discharge. The discharge is the total amount of fluid per unit time that travels through a specific cross-section. The results showed that the coefficient of discharge between the CFD and the experiment results is very close to each other. In general, the coefficient of discharge for a venturi tube has usually been estimated to be between 0.92 and 0.99 . However, the CV is 0.91 in some flow rates due to the greater theoretical mass flow rates recorded and measurement uncertainty. On the other hand, the CV value is similar to Tukimin et al. work on the venturi tube flow and its discharge coefficient. Therefore, numerical and experimental test findings provide good confirmation for one another.
4. Conclusion
Compared to experimental results, numerical simulations of water flow in the venturi tube produce quantitatively satisfactory results for a variety of operating regimes (i.e., different water flow rates). The numerical simulation and experimental results were found to be consistent through various inlet mass flow rates. The velocity and pressure distributions were examined using different plots and graphs. The CFD simulations of the coefficient of discharge for different inlet mass flow rates are from 0.96 to 0.98, and with experimental methods, their values range from 0.91 to 0.98. CFD simulation results show the discharge coefficients that are very near each other. Similarly, the coefficient of discharge (CV) results difference between the numerical simulation and experimental test is 1.12%. All the analysis and results found confirm that the numerical simulation and experimental test results verified for the venturi tube's suitability for liquid water flow applications.
Abbreviations

Cv

Coefficient of Discharge

P

Pressure Change

ṁtheor

Theoretical Mass Flow Rate

ṁact

Actual Mass Flow Rate

Red

Reynold Number

ρ

Density

CFD

Computational Fluid Dynamics

Author Contributions
Sintayehu Assefa Endaylalu is the sole author. The author read and approved the final manuscript.
Data Availability Statement
The data that support the findings of this study are available from the corresponding author upon reasonable request.
Conflicts of Interest
The author declares no conflict of interest.
References
[1] Ghassemi, H. and H. F. Fasih, Application of small size cavitating venturi as flow controller and flow meter. Flow Measurement and Instrumentation, 2011. 22(5): p. 406-412.
[2] Bermejo, D., X. Escaler, and R. Ruíz-Mansilla, Experimental investigation of a cavitating Venturi and its application to flow metering. Flow Measurement and Instrumentation, 2021. 78: p. 101868.
[3] Wang, C., G. Wang, and H. Ding, Thermal effect on body temperature distribution of the critical flow Venturi nozzle. Experimental Thermal and Fluid Science, 2016. 79: p. 187-194.
[4] Zhang, X., et al., Study of mechanical choked Venturi nozzles used for liquid flow controlling. Flow Measurement and Instrumentation, 2019. 65: p. 158-165.
[5] Yuan, C., et al., Experimental investigation of wet gas over reading in Venturi. Experimental Thermal and Fluid Science, 2015. 66: p. 63-71.
[6] Olaru, I. A Study of a Fluid Flow in the Jet Ejector System Used in Industrial Applications. in IOP Conference Series: Materials Science and Engineering. 2021. IOP Publishing.
[7] Uthale, S., et al., Design and analysis of Venturi turbine to recover waste air energy in industrial applications. Journal of Optoelectronics Laser, 2023. 42(4): p. 18-29.
[8] Chang, D. S., et al., A Venturi microregulator array module for distributed pressure control. Microfluidics and nanofluidics, 2010. 9: p. 671-680.
[9] Shankar, V., et al., Flow induced venturi cavitation to improve energy efficiency in pulp production. Journal of Fluid Flow, Heat and Mass Transfer (JFFHMT), 2018. 5(1): p. 10-17.
[10] Hong, S. B., H. S. Yun, and M. K. Cho, Application of the Bernoulli Effect for Improving Smoke Exhaust Efficiency in Tunnel Fires. IEEE Access, 2023.
[11] Bhola, D. R., CFD analysis of flow through venturi of carburetor. 2011.
[12] Zhang, L., et al., Study on the Influence and Optimization of the Venturi Effect on the Natural Ventilation of Buildings in the Xichang Area. Energies, 2021. 14(16): p. 5053.
[13] Levi, E., A fluidic vortex device for water treatment processes. Journal of Hydraulic Research, 1983. 21(1): p. 17-31.
[14] Wells, K. and A. Sharifian, Design of short Venturi flow meters for incompressible and isothermal flow applications. Heliyon, 2024. 10(7): p. e29311.
[15] Reader-Harris, M., Orifice plates and venturi tubes. 2015: Springer.
[16] Perumal, K. and J. Krishnan, A CFD study of the effect of venturi geometry on high pressure wet gas metering. International Journal of Oil, Gas and Coal Technology, 2013. 6(5): p. 549-566.
[17] Vijay, P. H. and V. Subrahmanyam, CFD simulation on different geometries of venturimeter. Momentum, 2014. 1(A2v2): p. 4.
[18] Yanagihara, S., et al., Variable area venturi-type exhaust gas flow meter. JSAE review, 1999. 20(2): p. 265-267.
[19] Khan, Z. A., N. Jain, and S. Anbu Kumar, Optimization of convergent angle of the Venturi meter for best coefficient of discharge. Water Supply, 2022. 22(12): p. 9023-9040.
[20] Nithin, T., N. Jain, and A. Hiriyannaiah. Optimization of venturi flow meter model for the angle of divergence with minimal pressure drop by computational fluid dynamics method. in International Conference on Challenges and Opportunities in Mechanical Engineering, Industrial Engineering and Management Studies. 2012.
[21] Zhang, J., Analysis on the effect of venturi tube structural parameters on fluid flow. AIP Advances, 2017. 7(6).
[22] Haynes, W. M., Handbook of Chemistry and Physics. 97th ed. ed. 2015, Boca Raton, FL, USA: CRC Press.
[23] Morris, A. S., Measurement and instrumentation principles. Measurement Science and Technology, 2001. 12(10): p. 1743-1744.
[24] Wang, Z., et al., High-speed photography and particle image velocimetry of cavitation in a Venturi tube. Physics of Fluids, 2024. 36(4).
[25] Hutagalung, S. S. Estimation optimal value of discharge coefficient in a Venturi tubes. in Journal of Physics: Conference Series. 2019. IOP Publishing.
[26] Tukimin, A., M. Zuber, and K. A. Ahmad, CFD analysis of flow through Venturi tube and its discharge coefficient. IOP Conference Series: Materials Science and Engineering, 2016. 152(1): p. 012062.
Cite This Article
  • APA Style

    Endaylalu, S. A. (2025). A Numerical and Experimental Investigation of Fluid Flow Through a Venturi Tube. American Journal of Mechanical and Industrial Engineering, 10(6), 116-127. https://doi.org/10.11648/j.ajmie.20251006.13

    Copy | Download

    ACS Style

    Endaylalu, S. A. A Numerical and Experimental Investigation of Fluid Flow Through a Venturi Tube. Am. J. Mech. Ind. Eng. 2025, 10(6), 116-127. doi: 10.11648/j.ajmie.20251006.13

    Copy | Download

    AMA Style

    Endaylalu SA. A Numerical and Experimental Investigation of Fluid Flow Through a Venturi Tube. Am J Mech Ind Eng. 2025;10(6):116-127. doi: 10.11648/j.ajmie.20251006.13

    Copy | Download

  • @article{10.11648/j.ajmie.20251006.13,
      author = {Sintayehu Assefa Endaylalu},
      title = {A Numerical and Experimental Investigation of Fluid Flow Through a Venturi Tube},
      journal = {American Journal of Mechanical and Industrial Engineering},
      volume = {10},
      number = {6},
      pages = {116-127},
      doi = {10.11648/j.ajmie.20251006.13},
      url = {https://doi.org/10.11648/j.ajmie.20251006.13},
      eprint = {https://article.sciencepublishinggroup.com/pdf/10.11648.j.ajmie.20251006.13},
      abstract = {Venturi tubes serve as critical components in various engineering fields. This work focused on investigating the pressure distribution and velocity magnitude from inlet to outlet of the venturi tube, as well as the determination of its performance in terms of coefficient of discharge (CV) using the computational fluid dynamics (CFD) tool Ansys Fluent and experimental tests. The study was conducted in different water fluid actual mass flow rates from 0.1662 to 1.0272 kg/sec. The results show that increasing the inlet flow rate yields an increase in pressure drop, velocity magnitude, and a minor rise in the coefficient of discharge. The study also focused on the inlet/out and throat diameter ratio from 0.207 to 0.586, and the coefficient of discharge increased from 0.11 to 0.96, respectively. The performance is higher in the lowest diameter ratio. On the other hand, the flow separation gradually developed in the divergent section when the diameter ratio decreased. There was a small variation between the CFD results and the experimental test results. The CV was the main performance evaluation of the venturi tube and have 1.95% and 8.01% a maximum difference between the numerical simulation and experimental study results at various inlet flow rates, respectively. Similarly, the coefficient of discharge result difference between the numerical simulation and experimental test is 1.12%.},
     year = {2025}
    }
    

    Copy | Download

  • TY  - JOUR
    T1  - A Numerical and Experimental Investigation of Fluid Flow Through a Venturi Tube
    AU  - Sintayehu Assefa Endaylalu
    Y1  - 2025/12/09
    PY  - 2025
    N1  - https://doi.org/10.11648/j.ajmie.20251006.13
    DO  - 10.11648/j.ajmie.20251006.13
    T2  - American Journal of Mechanical and Industrial Engineering
    JF  - American Journal of Mechanical and Industrial Engineering
    JO  - American Journal of Mechanical and Industrial Engineering
    SP  - 116
    EP  - 127
    PB  - Science Publishing Group
    SN  - 2575-6060
    UR  - https://doi.org/10.11648/j.ajmie.20251006.13
    AB  - Venturi tubes serve as critical components in various engineering fields. This work focused on investigating the pressure distribution and velocity magnitude from inlet to outlet of the venturi tube, as well as the determination of its performance in terms of coefficient of discharge (CV) using the computational fluid dynamics (CFD) tool Ansys Fluent and experimental tests. The study was conducted in different water fluid actual mass flow rates from 0.1662 to 1.0272 kg/sec. The results show that increasing the inlet flow rate yields an increase in pressure drop, velocity magnitude, and a minor rise in the coefficient of discharge. The study also focused on the inlet/out and throat diameter ratio from 0.207 to 0.586, and the coefficient of discharge increased from 0.11 to 0.96, respectively. The performance is higher in the lowest diameter ratio. On the other hand, the flow separation gradually developed in the divergent section when the diameter ratio decreased. There was a small variation between the CFD results and the experimental test results. The CV was the main performance evaluation of the venturi tube and have 1.95% and 8.01% a maximum difference between the numerical simulation and experimental study results at various inlet flow rates, respectively. Similarly, the coefficient of discharge result difference between the numerical simulation and experimental test is 1.12%.
    VL  - 10
    IS  - 6
    ER  - 

    Copy | Download

Author Information